Learn About Your Statement of Financial Position
The Statement of Financial Position is a report that shows what your organization owns, what it owes, and what's left over. It's the nonprofit equivalent of a balance sheet — one of the official accounting reports that nonprofit organizations are required to produce.
Unlike the Statement of Activities, which summarizes income and expenses over a period of time, the Statement of Financial Position is a snapshot of your organization's financial standing at a specific point in time.
What can the Statement of Financial Position tell me?
The Statement of Financial Position gives you a clear picture of your organization's financial health at a glance. It shows:
- What you own (Assets): Cash on hand, money owed to you, property, equipment, and other resources your organization holds.
- What you owe (Liabilities): Outstanding bills, credit card balances, loans, and other debts.
- What's yours to keep (Net Assets): The difference between your assets and liabilities, which is essentially, your organization's financial cushion. Net assets are broken into funds held without donor restrictions and funds held with donor restrictions.
This report is especially useful for board meetings, grant applications, and year-end financial reviews, since it helps stakeholders quickly assess the overall stability of your organization.
Where can I find the Statement of Financial Position in my MonkeyPod?
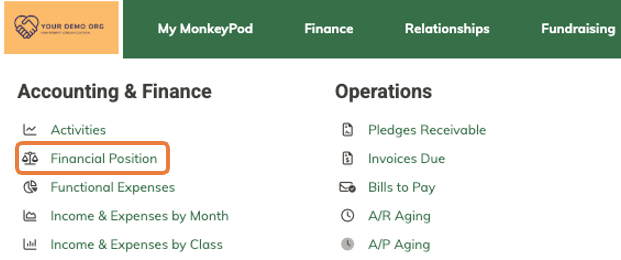
You can generate your Statement of Financial Position by choosing Reports > Financial Position from the main menu, configuring the options there, and clicking Run Report.
What are my options for configuring the Statement of Financial Position?
Use the options in the Report Settings panel to configure your statement of financial position.
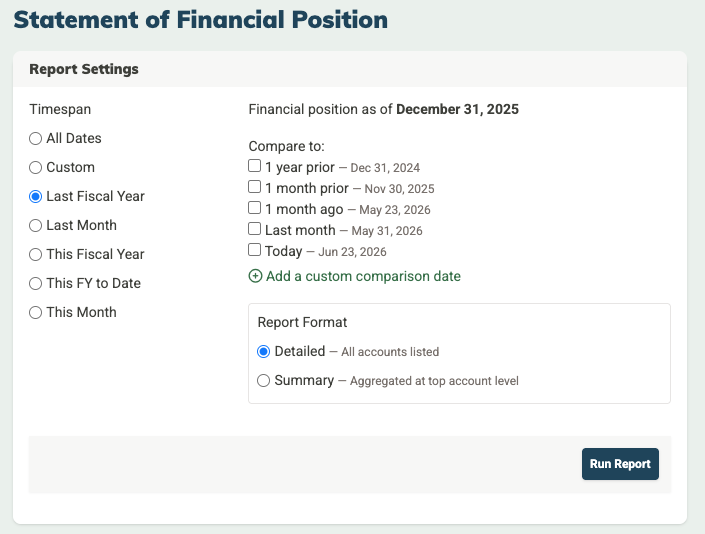
Report Settings
- Timespan: Select a timespan to set the date for your snapshot. Because this is a point-in-time report (rather than a period report), the timespan you select determines the "as of" date shown at the top of the report — for example, "As of June 23, 2026."
- Compare to: You can optionally add a comparison column to see how your financial position has changed over time. This is great for spotting trends or presenting your board with a before-and-after view.
- Report Format: Choose between:
- Detailed — All accounts are listed, giving you the full breakdown of every asset, liability, and net asset account.
- Summary — Accounts are aggregated at the top-level category, giving you a cleaner, high-level view. This is often the right choice for board reports.
Can I save my Statement of Financial Position?
Yes! Once you've configured the report settings, click Save Report. After naming and saving the report, it will appear in the Reports menu under "Saved Reports" and will be available to everyone who has permissions to view financial reports in your MonkeyPod. (See Overview of User Roles & Permissions for details.)
Important note about relative timespans of "This" and "Last"
Just remember that choosing "Last" or "This" timespans will be relative to the point when you run the report. So for example: If you save a report in December 2024 with a "This Month" timespan and then run it in January 2025, the report will show the financial position as of January 31, 2025 because that is now this month. If you want to keep the date static, use a Custom timespan and enter the specific date.
How can MonkeyPod help me make sense of my Statement of Financial Position?
The ✨ Analyze button at the top of the Statement of Financial Position uses AI to surface helpful insights from your financial data, drawing on industry benchmarks from public sources for context. It generates a concise financial health briefing that summarizes your organization's current position, highlights potential concerns, flags future considerations, and offers strategic recommendations.
This analysis is not intended to replace human judgment or decision-making.
About MonkeyPod's use of AI
MonkeyPod takes your privacy very seriously. Details about MonkeyPod's policy and use of AI can be found in this article about How MonkeyPod Uses AI.
Frequently Asked Questions
I'm new to nonprofit accounting. Can you explain what's on this report?
Sure! Here are the three main sections:
- Assets: Everything your organization owns or is owed. This includes cash in your bank accounts, amounts owed to you (accounts receivable and contributions receivable), physical property like buildings or equipment, and any other resources your organization holds.
- Liabilities: Everything your organization owes to others. This includes unpaid bills, credit card balances, loans, and other obligations.
- Net Assets: This is assets minus liabilities — what remains after all debts are accounted for. Net assets are split into two categories:
- Without Donor Restrictions: Funds your organization can use for any purpose that supports your mission.
- With Donor Restrictions: Funds that must be used for a specific purpose or within a specific timeframe, as specified by the donor.
Where are these account categories coming from?
The accounts and categories in your Statement of Financial Position come from your Chart of Accounts. Balance sheet account types include Assets, Liabilities, and Net Assets.
What's the difference between the Statement of Financial Position and the Statement of Activities?
The Statement of Activities shows what happened financially over a period of time (income and expenses). The Statement of Financial Position shows where things stand at a single point in time (what you own, owe, and have left). Think of the Statement of Activities as your organization's story over the year, and the Statement of Financial Position as a photograph of your finances on a specific date.
I'd like to share this with my board. Can I get a visual version?
Absolutely! Just click the "Visualize" tab for the report to see a chart view. Use the "hamburger" menu at the right of the screen to download and save the chart as an image.